
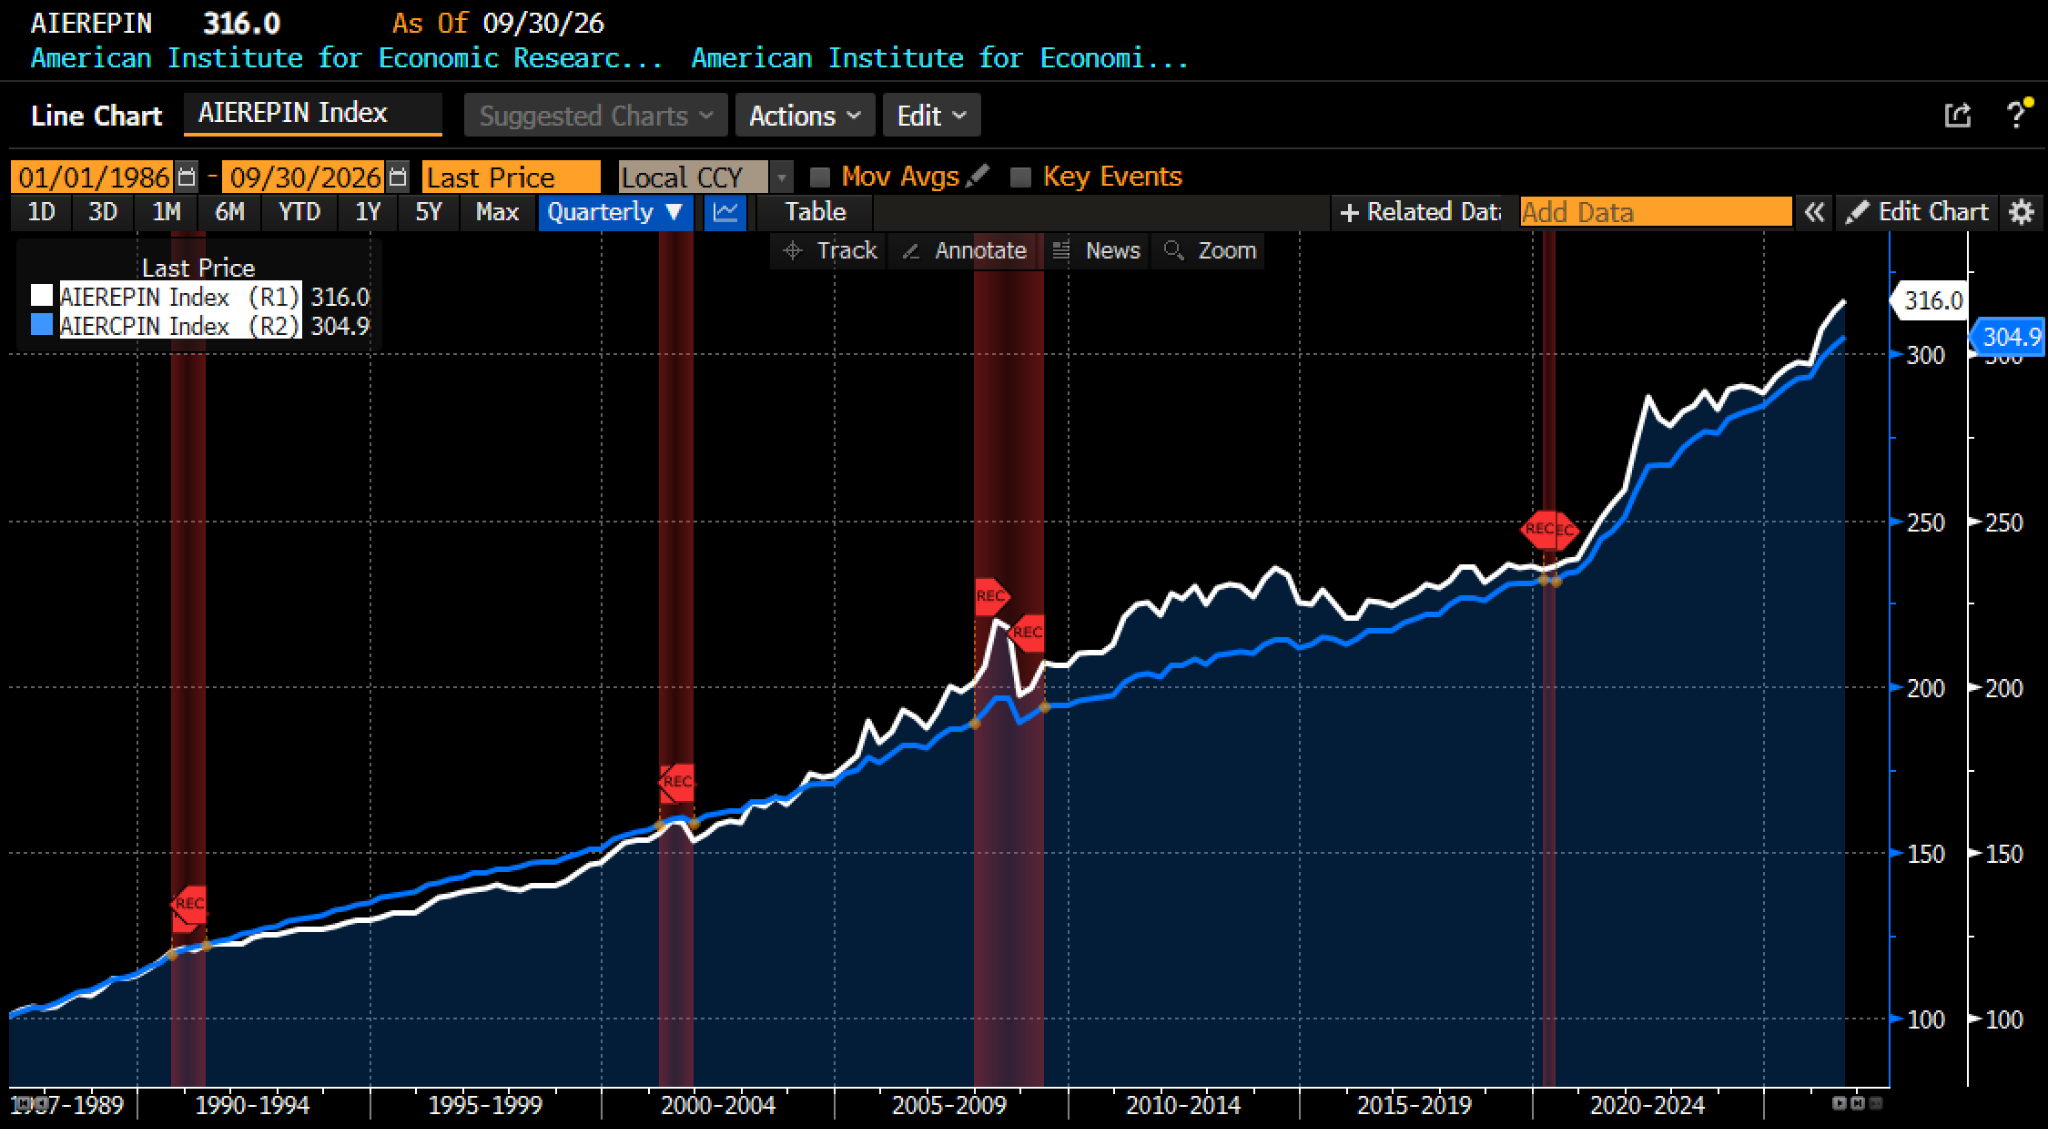
The American Institute for Economic Research’s Everyday Price Index (EPI) rose 0.87 percent in September 2026, reaching 316.0. Following August’s reported 0.33 percent advance, September marked a second consecutive monthly increase and the largest gain since May. The index now stands 6.41 percent above its December 2025 level and 6.19 percent above September 2025. Price increases outnumbered declines across our basket: 15 components rose, eight fell, and one was unchanged. Although increases were relatively widespread, the magnitude of September’s advance was primarily driven by motor fuel.
Motor fuel rose 6.68 percent, the largest monthly increase among EPI components. Recreational reading materials followed with a 2.21 percent gain, while intracity transportation rose 2.16 percent. The largest price declines were observed in purchases, subscriptions, and rentals of video, down 2.53 percent; internet services and electronic information providers, down 1.31 percent; and prescription drugs, down 1.25 percent. With a current weight of approximately 12.55 percent in the EPI, motor fuel contributed 0.84 percentage points to September’s increase: roughly 96 percent of the total monthly rise. The remaining 23 components added only about 0.03 percentage points, with the collective increases and decreases essentially offsetting one another.
AIER Everyday Price Index vs. US Consumer Price Index (NSA, 1987 = 100)
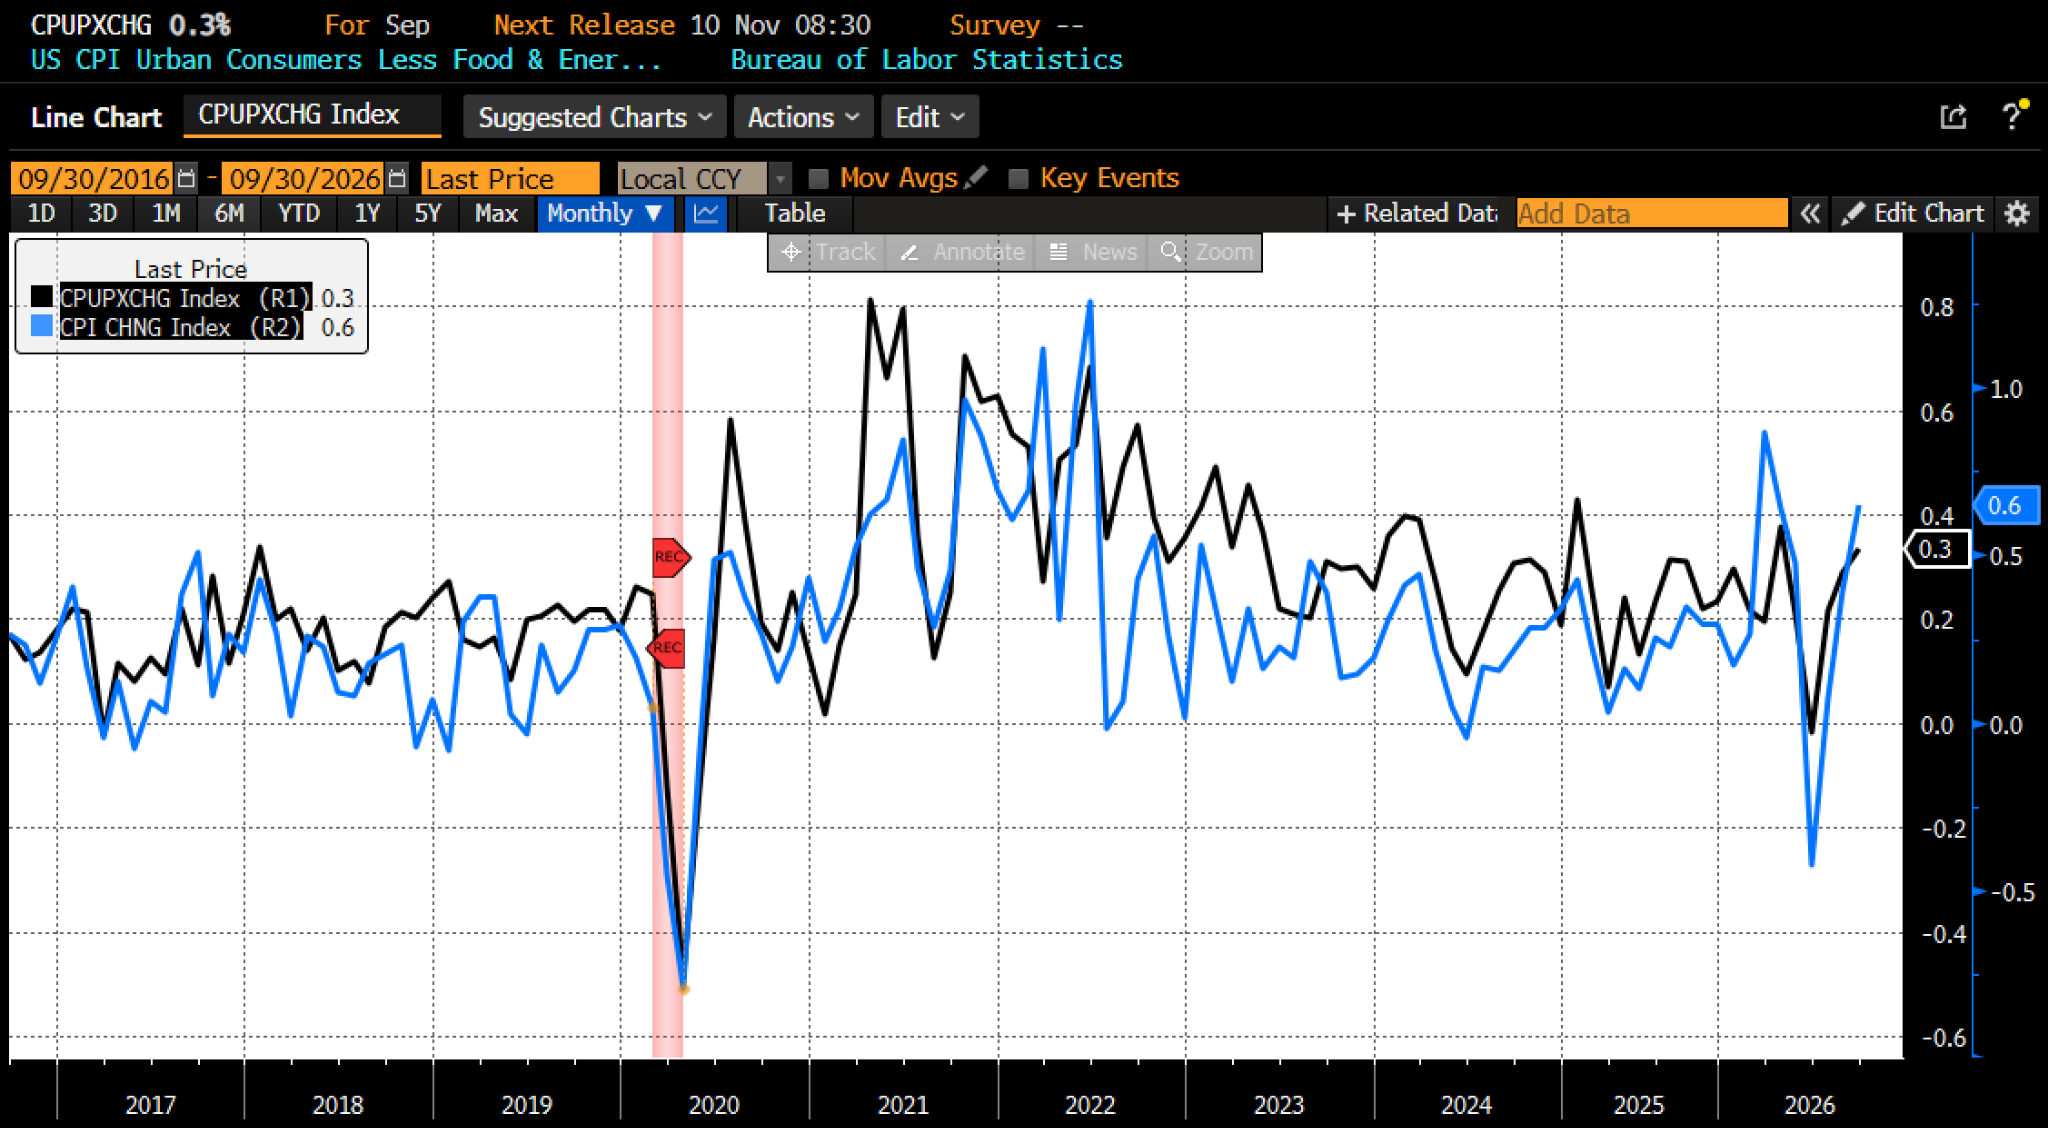
The Bureau of Labor Statistics’ September 2026 report, released on October 14, also depicted a pronounced acceleration in headline consumer prices. The seasonally adjusted Consumer Price Index rose 0.6 percent, following increases of 0.4 percent in August and 0.1 percent in July. Core CPI, which excludes food and energy, advanced 0.3 percent, matching August’s pace. On an unadjusted basis, the all-items CPI also increased 0.6 percent, reaching 336.940 on its 1982–84 reference base. September’s faster headline reading reflected a substantial energy contribution rather than an acceleration in the core rate.
September 2026 US CPI headline and core month-over-month (2016–present)
The EPI’s larger increase underscores how examining the price trends of frequently purchased goods and services can reveal a different inflation experience from the broader CPI basket. Fuel purchases were especially important this month, while food and utilities registered much smaller changes in AIER’s more focused index.
Energy prices rose 5.2 percent on a seasonally adjusted basis, accelerating from August’s 2.1 percent increase. Gasoline jumped 9.1 percent and accounted for more than half of the monthly rise in the all-items CPI. Before seasonal adjustment, gasoline prices increased 6.5 percent. Fuel oil also registered a substantial gain, rising 15.3 percent after adjustment. Household energy services were considerably more restrained: electricity increased 0.2 percent, while utility piped natural gas declined 0.3 percent. September’s energy pressure was thus concentrated in liquid fuels rather than shared evenly across household energy expenses.
Shelter provided another source of upward pressure, increasing 0.4 percent after a 0.3 percent rise in the previous month. Owners’ equivalent rent advanced 0.3 percent, compared with 0.2 percent the previous month, while rent of primary residence again increased 0.2 percent. Lodging away from home rose 2.0 percent on top of August’s 2.4 percent gain. Unlike the abrupt movement in fuel prices, shelter’s contribution reflected continued increases across several categories, adding persistence to the broader inflation picture.
Food prices offered an unusual partial counterweight. The overall food index was unchanged in September after increasing 0.1 percent in both July and August, and food at home declined 0.1 percent. Three of the six major grocery categories fell. Meats, poultry, fish, and eggs decreased 0.5 percent, including a 1.0 percent decline in beef and veal and a 1.3 percent drop in egg prices. Dairy and related products fell 0.9 percent, with milk down 2.0 percent. Other food at home decreased 0.2 percent. These helped contain the grocery total despite increases elsewhere in the supermarket basket.
The remaining grocery categories moved higher. Nonalcoholic beverages increased 0.9 percent, led in part by a 1.5 percent rise in carbonated drinks. Fruits and vegetables gained 0.5 percent, reversing August’s decline, while cereals and bakery products edged up 0.1 percent. Restaurant prices continued to increase, although more slowly than in August: food away from home rose 0.2 percent, compared with 0.3 percent previously. Full-service meals increased 0.3 percent and limited-service meals advanced 0.2 percent. Overall food stability therefore concealed continued differences between grocery categories and between meals purchased for home preparation and those purchased outside the home.
Beyond food and energy, September brought increases across several goods and services. Recreation rose 0.5 percent after being unchanged in August; used cars and trucks increased 0.7 percent. Education prices advanced 0.6 percent, airline fares rose 1.2 percent, and apparel increased 0.3 percent. New vehicles added 0.2 percent. Despite broad gains, the monthly core CPI rate remained at 0.3 percent. Core commodities increased 0.3 percent, while services excluding energy services rose 0.4 percent, indicating that underlying price pressure remained present on both sides of the goods versus services divide.
Other categories moderated that pressure. Communication prices declined 0.2 percent, and household furnishings and operations were unchanged. Medical care increased just 0.1 percent, but its components diverged: hospital services rose 0.7 percent and dental services increased 0.5 percent, while physicians’ services were unchanged and prescription drugs fell 1.2 percent. Motor vehicle insurance edged up 0.1 percent. These mixed results reinforce the distinction between a steady aggregate core reading and the varied price movements underlying it.
September 2026 US CPI headline and core year-over-year (2016 – present)
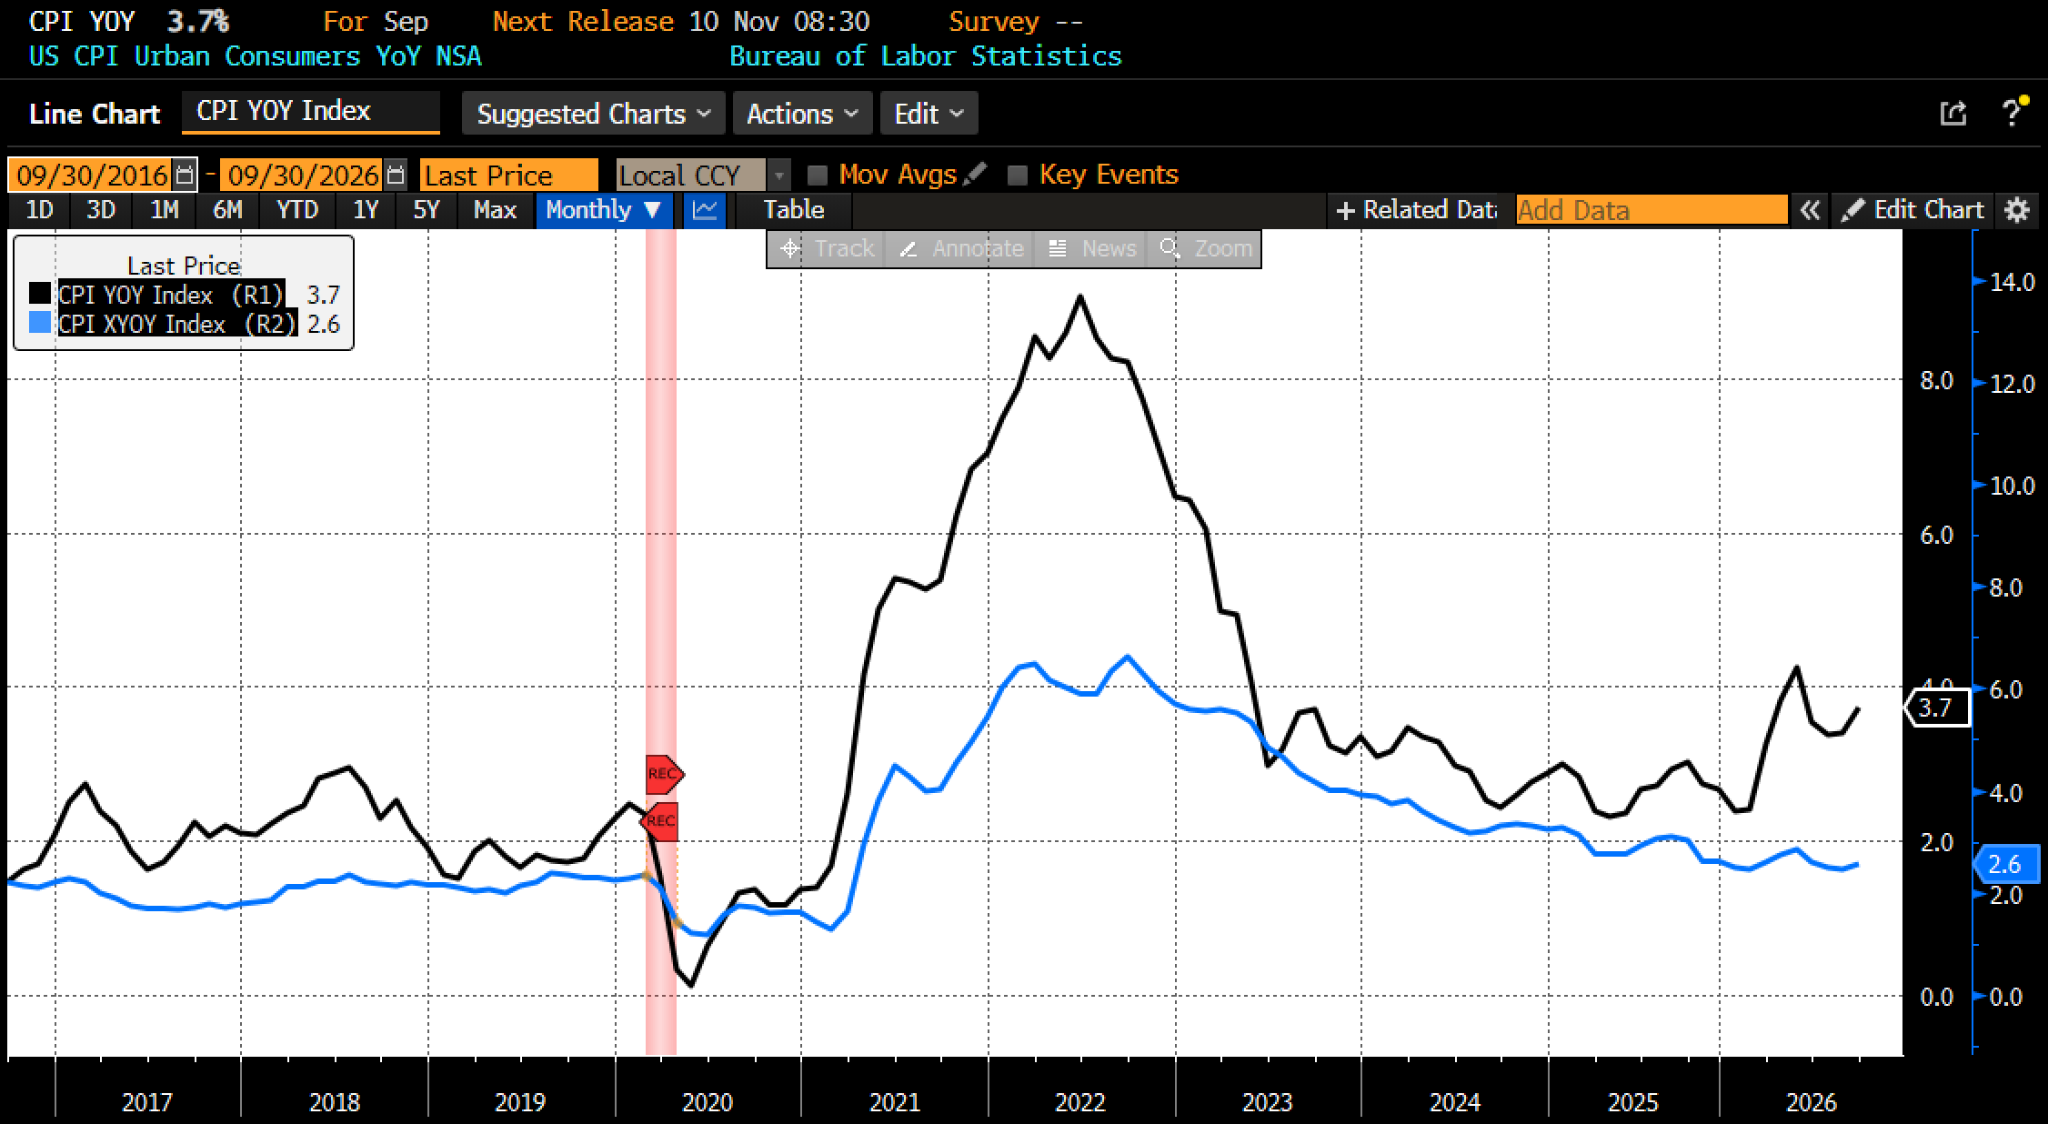
Over the preceding 12 months, headline CPI increased 3.7 percent, up from 3.4 percent in August. Core inflation also moved higher, reaching 2.6 percent from 2.4 percent, reversing August’s easing in the annual rate even though the monthly increase was unchanged. Food inflation, by contrast, slowed to 2.5 percent from 2.7 percent. Grocery prices were 1.8 percent above their year-earlier level, compared with 2.2 percent in August, while food away from home increased 3.5 percent annually, slightly above August’s 3.4 percent pace.
Annual grocery changes remained uneven. Nonalcoholic beverages were up 3.8 percent and fruits and vegetables increased 3.7 percent, while cereals and bakery products rose 2.1 percent. Meats, poultry, fish, and eggs increased only 0.3 percent as a group, and dairy prices declined 0.7 percent. Energy presented a sharply different picture: its annual increase reached 20.4 percent, compared with 16.3 percent in August. Gasoline prices were 34.2 percent higher than a year earlier, while electricity and utility natural gas increased 4.4 and 5.0 percent, respectively.
Shelter inflation reached 3.2 percent annually, while airline fares remained 22.4 percent above their year-earlier level. Yet used vehicle prices were down 1.5 percent, prescription drugs declined 4.5 percent, and motor vehicle insurance fell 5.0 percent over the same period.
In September 2026, surging gasoline prices intensified pressure on household budgets and underlying inflation firmed. Higher energy costs are raising transportation and distribution expenses, creating the potential for further price increases throughout the economy. Shelter remains a major source of core inflation, while stronger goods prices complicate the outlook for disinflation. With inflation-adjusted wages declining but consumption remaining robust, households face worsening purchasing power without the clear weakening in demand that would give the Fed confidence price pressures are subsiding.
Nevertheless, the composition of the increase offers some reassurance alongside warning signs. Shelter accounted for more than half the monthly core increase, driven principally by owners’ equivalent rent, with used cars and recreation goods also contributing. Services inflation strengthened, although grocery prices and medical care commodities declined. The breadth of inflation narrowed even as the aggregate reading accelerated, suggesting that the deterioration was concentrated in particular categories. The unexpected strength in measured housing costs, despite a relatively cool housing market, also raises the possibility that part of September’s increase will prove temporary.
In all, the September results strengthen the case for further Fed tightening without making an immediate increase inevitable. Just after the publication of the BLS data, market expectations shifted toward a greater likelihood of another hike, but officials have signaled room to evaluate incoming data before acting again. A hold on additional tightening through year-end remains possible, although the forthcoming US Personal Consumption Expenditures data will be central to policy direction. Further tightening becomes more likely if services inflation persists, fuel costs spread more broadly through the economy, and strong demand prevents renewed progress toward price stability.
To maintain consistency in the preparation and presentation of the AIER Everyday Price Index, portions of the report are completed with the assistance of artificial intelligence. All analysis, conclusions, and editorial decisions are reviewed by AIER research staff.
Share This Article

Post on Facebook

Post on X

Print Article

Email Article